Statistical Evaluation of Casualties in Iraq
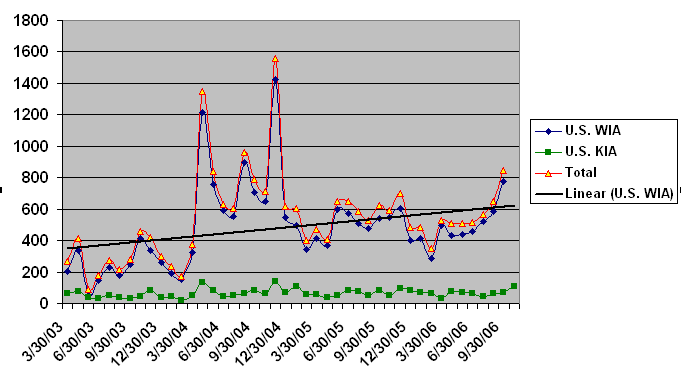
BY Herschel SmithA graphical depiction of the casualties in Iraq is shown below. Included on the graph are:
- U.S. killed in action since the start of the war.
- U.S. wounded in action since the start of the war.
- Total (sum of U.S. killed and wounded since the start of the war).
- Linear trend line using EXCEL function (“Add Trendline”).

Upon first glance it may seem that the data is rather random, but a more protracted analysis yields significant and useful fruit.
The trend for U.S. killed in action, while representing something profoundly tragic, statistically speaking, doesn’t tell the story of what is happening in Iraq. The total of killed and wounded both closely tracks and is dominated by wounded.
Examination of the total shows that the first two months, i.e., the months of the invasion, were months of relatively low casualties compared to what we see today. For the month of May 2003, after the regime was toppled, casualties were extremely low at 91 total killed and wounded. But by September of 2003, the total killed and wounded at 278 was higher than any at other time preceeding it, including the invasion.
Major terrorism soon began, and the two spikes in the data for April and November 2004 represent the first and second battles for Fallujah. If the second battle for Fallujah and the ostensibly huge victory the U.S. won were assumed to be the means to the end of the terrorism, then the month of May 2005 with a total killed and wounded of 648 should have been the final wakeup call to the administration and Pentagon that force projection was inadequate and troops needed to be added, and quickly.
At this point, no matter how administratively difficult it might have been to re-deploy troops from Japan and Europe to Iraq, it should have been obvious that the healing powers the U.S. believed to be there with democracy were merely a phantom. It should have been obvious that al Sadr had to be taken out, the Sunnis were not going to go lightly from the scene of control over Iraq, and global terrorists were pouring into Iraq.
At Ramadan, beginning near the end of September and going though the end of October, there has always been a spike in the violence.
Finally, the trend line added in by EXCEL shows that there has been a general trend of increasing violence since the inception of the war. It has a low correlation coefficient, but smoothing of the Fallujah data increases the correlation of the trend to the data. There is no mistaking the fact that the adminstration and Pentagon have watched over three and a half years as violence has increased, and yet the force projection has either remained the same, decreased or barely increased.


No comments yet.
RSS feed for comments on this post. TrackBack URL
Leave a comment